
Super Tuesday Cyclist Count conducted in partnership with:


Prepared by Dr Ian Radbone, Super Tuesday Coordinator, supertuesday@bikeadelaide.azurewebsites.net
2023 General Commentary
Introduction
The Super Tuesday count is a national count of cyclists and pedestrians undertaken on the first Tuesday in March since 2009, as an initiative of the Melbourne-based Bicycle Network. While five volunteers took the initiative to count cyclists in Adelaide in 2009, Super Tuesday only seriously began in Adelaide from 2010, when the City of Adelaide became involved.
The City of Adelaide soon began to undertake the counts using local knowledge and skills, with Bike Adelaide stepping in to help with volunteers and organisation. Super Tuesday is now organised as a partnership of Bike Adelaide and Walking SA in the City of Adelaide, as well as the Cities of Unley and Norwood, Payneham and St Peters, with these Councils supporting the count financially as well as through their volunteer programs.
This year we had a very good response to the call for volunteers, thanks to BikeSA helping us with recruitment. 83 locations were counted, 26 more higher than the previous record of 57, recorded in 2022. (Counts were also undertaken by the Bicycle Network, in the Cities of Holdfast Bay and Port Adelaide Enfield.)
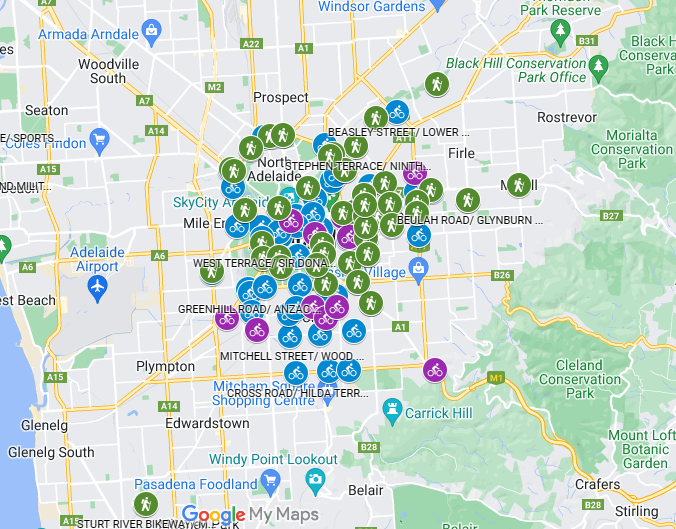
The results of this year’s count can be seen on an locational basis using a clickable map.
The much higher number of locations this year could be only managed with more volunteers, which creates greater demands on organising recruitment and then undertaking data entry. This year, the Unley Bicycle User Group handled recruitment and data entry in the City of Unley, where 23 intersections were counted.
The location with the highest number of cyclists was at the intersection of Porter Street and Greenhill Road, where 394 cyclists were counted. This shows just how popular the Porter-Rugby route is for Unley and Mitcham cyclists. Other locations with large counts are the confluence of the River Torrens Linear Path and the Outer Harbor Greenway, just north of the Electranet Bridge over the Torrens (377 cyclists), and Pirie Street/ Frome Street and South Terrace/ Pulteney Street (both 359 cyclists).
To view intersection counts for 2023 click the map below.
Levels of cycling and the impact of Covid
This year saw an 11% increase in cycling levels, when the 53 intersections that were counted in both 2022 and 2023 are totalled.
This was the first year that a Super Tuesday count has been affected by rain: a light shower was experienced at many locations at the beginning of the count and a shower or two was forecast for the day. But even with the rain, it was expected that numbers would increase over the previous year because 2022 was dramatically affected by Covid.
The Super Tuesday counts have traditionally been designed to measure commuting by cycling to the CBD and so are very sensitive to activity levels in the CBD. The 2020 count was undertaken at a time when there was general concern about the spread of the pandemic into Australia, but no formal restrictions on activities. The 2021 count was undertaken at a time when SA’s isolation from other states and Australia’s isolation from the world enabled us to live reasonably normal lives, although many had taken to working from home or attending classes virtually, especially if they were overseas students. The 2022 count occurred a few months after SA was opened up to the rest of the world, the number of Covid infections was surging, and the State government had a policy of requiring close contacts of those infected to also isolate. There were also work-from-home mandates (such as a limit of 50% on the proportion of public servants allowed to work in the office) and the strengthening of social distancing requirements in offices and at public venues. It is not surprising that the numbers saw a decline of 24% – by far the biggest fall recorded in over a decade of counting.
The graph below gives the year-by-year change in numbers, where these can be ascertained (i.e. at locations that were also counted the year before – new locations tend to be added to Super Tuesday every year).
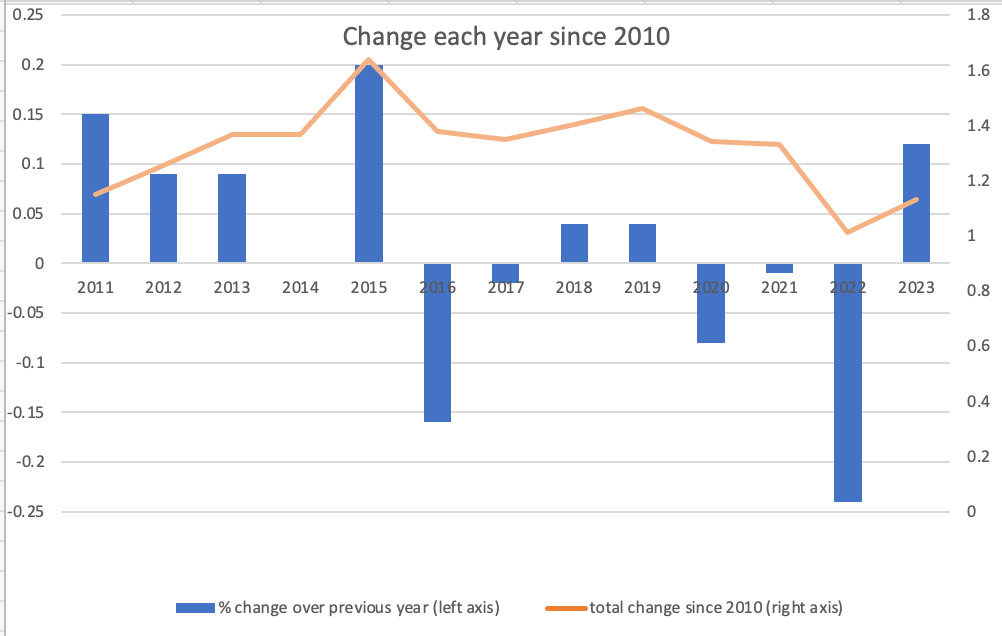
It shows that numbers have fallen since 2019, the last count before the Covid pandemic. We may well be in a new regime, where changed work and study habits will have a permanent impact on the numbers commuting, including commuting by bicycle.
While the impact of Covid can be inferred from the graph, it is noteworthy that the first five years of the past decade saw increases every year except 2014, whereas numbers plateaued at a lower level in the last four years of that decade.
This situation could be due to cycling conditions in the City. The first five years saw significant new cycling infrastructure each year: new bike lanes, often green, bike boxes at intersections, and of course the separated Frome Bikeway. New facilities from then on were largely confined to paths in the Park Lands, such as alongside South Terrace and Dequetteville Terrace. 2016 represents a bit of an ‘annus horiblis’: cycling conditions became worse on North Terrace, when the installation of tram lanes removed the wide kerbside lane that cyclists could formerly use. The shift of the Royal Adelaide Hospital and associated tertiary activities from the eastern side of the City to the western end would have had a bad impact on the cycling habits of medical staff and students who lived in the eastern suburbs. The impact can be seen in the graph of numbers counted at the corner of North Terrace and Pulteney Street.
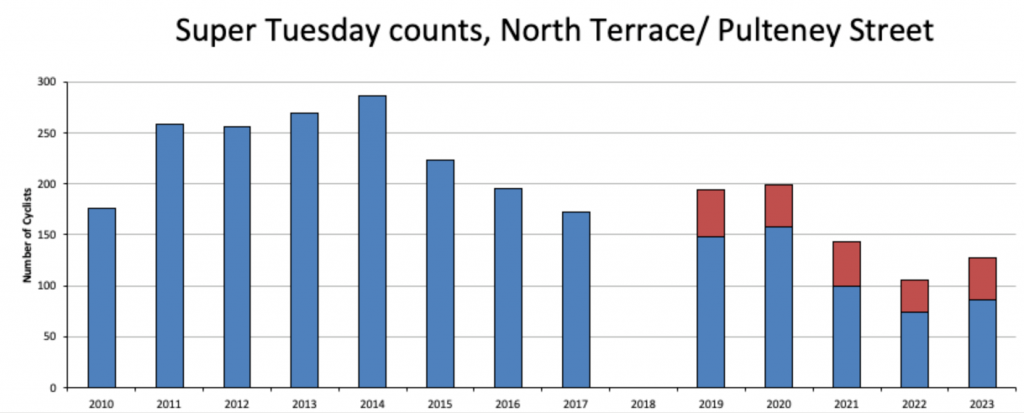
Similar halving of numbers from the peak can be seen on the other North Terrace counts. The western half of North Terrace also suffered due to the closing of Station Road, which had enabled direct access from the River Torrens to North Terrace, opposite Bank Street.
Cycling in the suburbs
Compared to 2022, cyclists counted in the City increased by 13% in 2023. Those in the suburbs grew by only 9%. However, the latter figure is misleading. The suburban figure is skewed by the opening of the River Torrens Linear Path after reconstruction. Its closure in 2022 saw cyclists having to divert to the street network. The City has two on-road counts and one count location where both on-road and RLTP cyclists are counted. There is no equivalent RTLP – only counting location in the suburbs, apart from at Felixstow, well to the east, where numbers are very low. If the on-road “detour” counts are excluded from the total, the increase for the suburbs was 13%, the same as for the City. The increase was bigger in the southern inner suburbs. Nine out of the ten Unley locations counted in both years saw an increase, and the increase for the ten locations totalled 16%.
Female cycling
T26% of those counted were female, slightly higher than in recent years. The highest percentage was 38%, at Halifax Street/ Frome Bikeway. Interestingly, the cyclist-unfriendly location of Port Road/ Park Terrace/ Adam Street had 37% recorded.
We have traditionally noted that the female count is likely to be an underestimate, and we note a recent academic report that about 34% of cyclists in Australia are female.
We expect that the Super Tuesday counts underestimate female cyclists because of three factors:
(1) It is often difficult to distinguish whether cyclists are male or female, particularly at locations where roads are wide and so those being counted might be 30m away. The situation has become worse with the general fashion for dark clothing in recent years. In cases where there is doubt, it is reasonable to adopt the “default” category – male.
(2) The process of counting requires that an extra action be taken to record a female: a special mark, and a mark in a separate column. At times counting can be quite hectic and the extra actions might be forgotten.
(3) The Super Tuesday count is taken on a weekday, from 7am-9am i.e. the traditional commuter peak. Women are more likely to have shift work that does not fit into a 9-5 work day, so will be under-represented in this period.
We note that the median female percentage is 23%; quite close to the average of 26%. With this, and with the first two factors above in mind, we have decided to exclude counts where the recorded female percentage is less than 10%. This year there were only five such locations, and because the total numbers at these locations tended to be low, their exclusion does not make a significant difference to the overall average proportion. It is still 26%.